Enabling and using developer tools
Chrome Developer Tools are disabled by default in Overwolf to protect users from potential security risks. Access is restricted to developers who have been approved by Overwolf. If you haven't yet submitted your app idea for review, see Submit your app idea. Once approved, you can enable Chrome Developer Tools through the command line or by adding a Windows registry key.
The easiest way to enable Chrome Developer Tools is to add a registry key.
Using the command line
To enable the Chrome Development Tools through the command line use overwolf.exe --ow-enable-features=enable-dev-tools.
To disable the Chrome Development Tools through the command line use overwolf.exe --ow-disable-features=enable-dev-tools.
Using this method, you may need to re-enable the Chrome Development Tools after a client update.
Using the windows registry key
To enable a feature through the registry:
- Open the regedit tool.
- Navigate to
[HKEY_CURRENT_USER\SOFTWARE\Overwolf\CEF]. - In the Edit menu, select New, and String value.
- In the Name field, enter
enable-featuresand in the Value data field, enterenable-dev-tools. Then press OK.
Using this method, you may not need to re-enable the Chrome Development Tools after a client update.
Uninstalling the Overwolf client removes the registry key.
The command line overrides the registry entry and will explicitly disable this feature even of the registry key is enabled.
Alternatively, download the enable dev tools tool. After downloading, run it to add and enable the registry key.
The Chrome Development Tools should be enabled. If the tools are not working, restart your computer.
Using developer tools
The Overwolf developer toolkit is a set of web authoring and debugging tools.
You can use these tools for a variety of tasks, among them: Listing which assets the page has requested, how long each asset took to load, reviewing tools for currently-loaded HTML, CSS or JS, and more.
Chrome Developer Tools are disabled by default. You can enable them by adding a registry key.
Accessing the Overwolf developer tools
Use the following methods to access the Overwolf developer tools.
Using hotkeys
- Run the app.
- Select the app window that you want to debug.
- Press Ctrl+Shift+I.
This will immediately open the development tools window for this app window. If it's not working, and you have just added the registry key, restart your machine and try again.
Using the Overwolf settings
- Right click on the Overwolf tray icon.
- Select Settings, then About, then Development options.
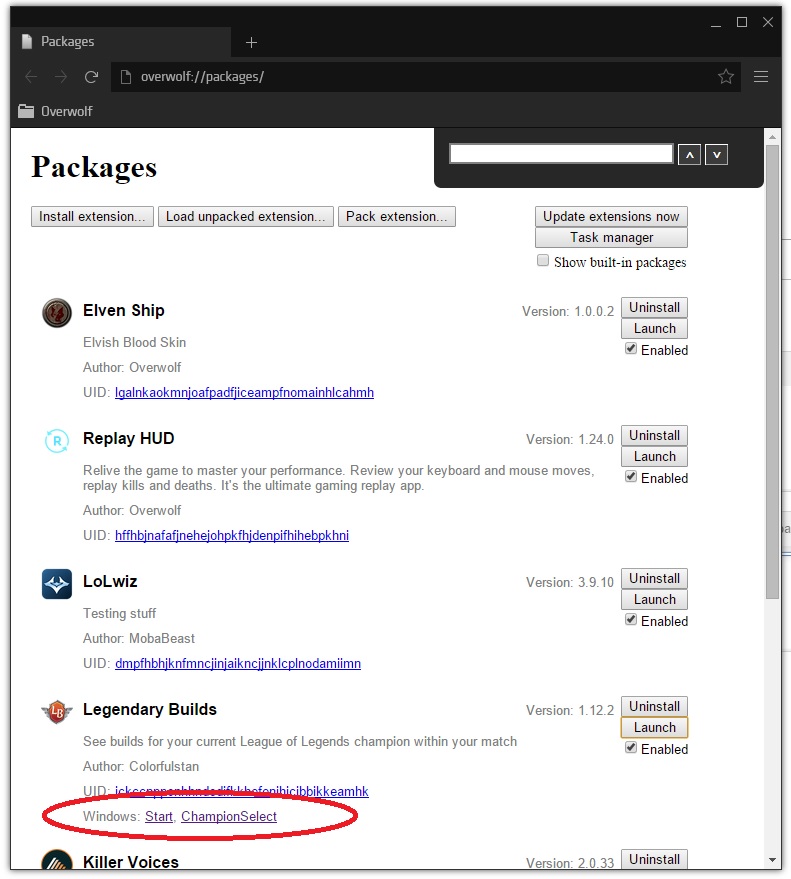
- Launch your app and select the relevant window's name in the Packages window.
After launching an app, the names of all of the app's active windows will show up in the Packages window, under the app's entry. Press on any window name to bring up its own instance of developer tools:
Developer tools menus
This section describes the different menu tabs in the developer tools window.
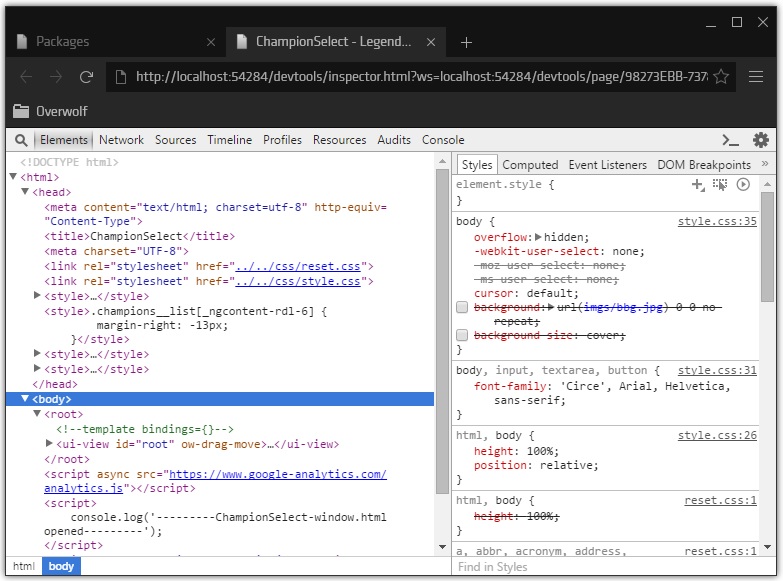
Elements
This tab allows you to see your app window's HTML code during runtime. In addition you can view and change the CSS styles applied to each element. Changing a CSS style element is temporary and will be lost when your app is closed.
Network
This tab displays information about every network related operation on a window. Use it to get insights into requests, downloaded resources, and opportunities to optimize the app's network performance.

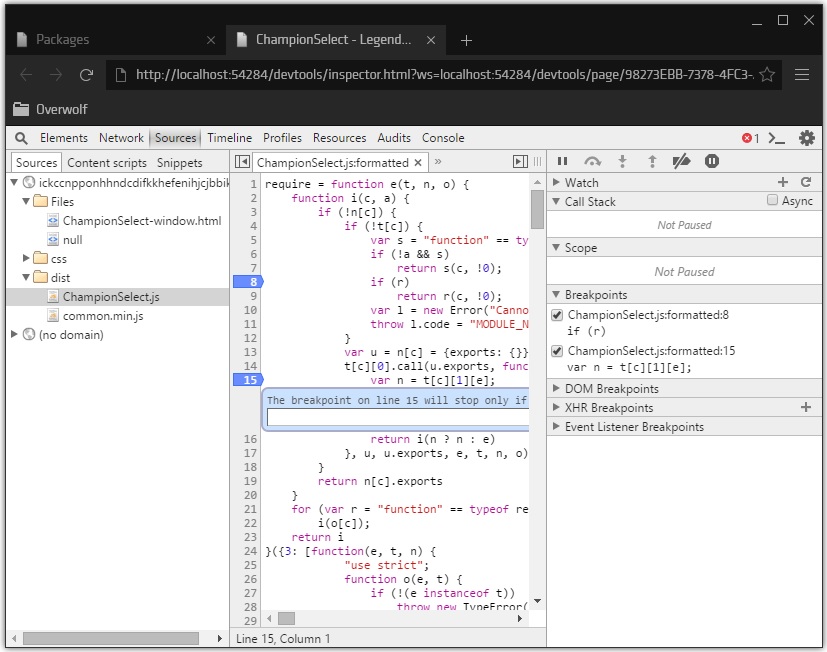
Sources
This tab enables breakpoint-based debugging for JavaScript. Breakpoints can be configured to be triggered at specific locations to help you debug your app. To add a breakpoint, right click the line number and select Add breakpoint from the menu. To remove a breakpoint, right click the line number with the breakpoint and select Remove breakpoint from the menu.
Make minified code easily readable by using the “pretty print” button () at the bottom left of the code pane.
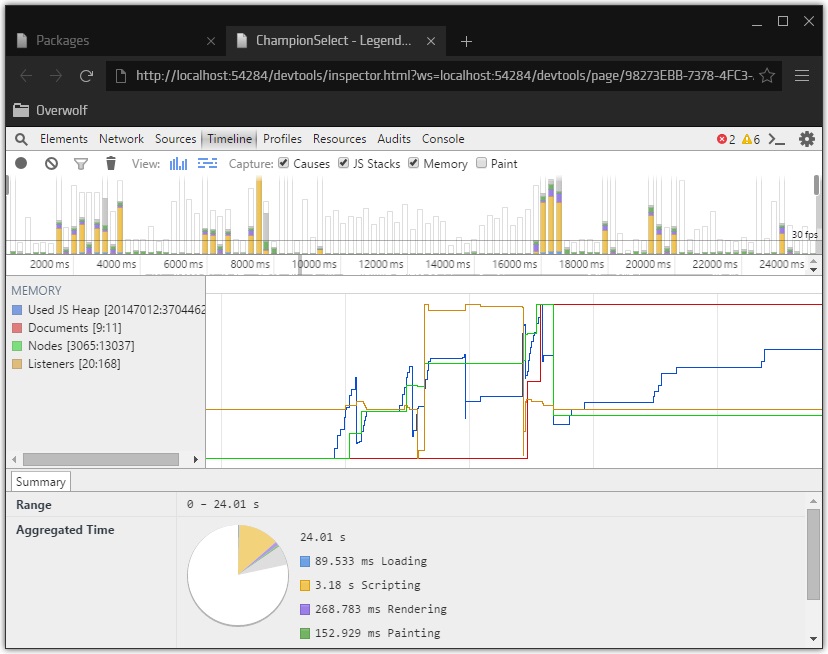
Timeline
This tab makes it easier to spot non-permanent or situational issues. It assists you in improving the performance of your app by inspecting events that happen during its usage timeline.
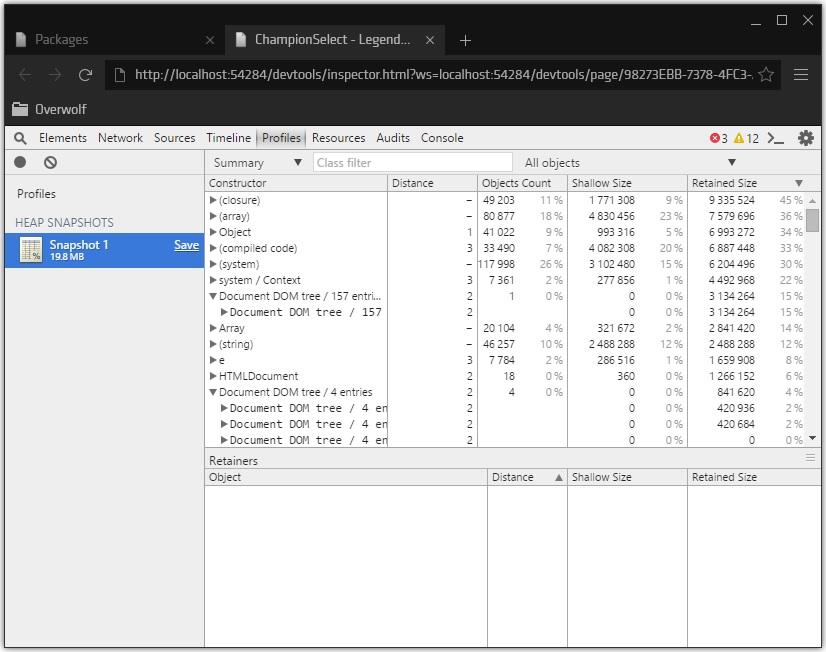
Profiles
This tab helps you learn more about the memory usage and execution times of your app. The CPU and Heap profilers help you find where resources are being spent, so that you can make sure that your app is running as smoothly as possible.
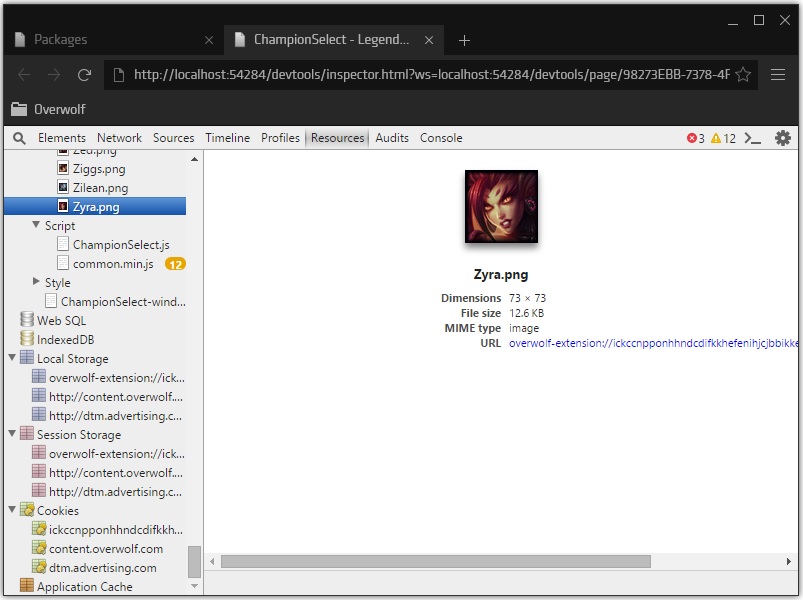
Resources
This tab shows a summary all of your app's loaded resources. This includes databases, session storage, app cache, cookies, fonts and more.
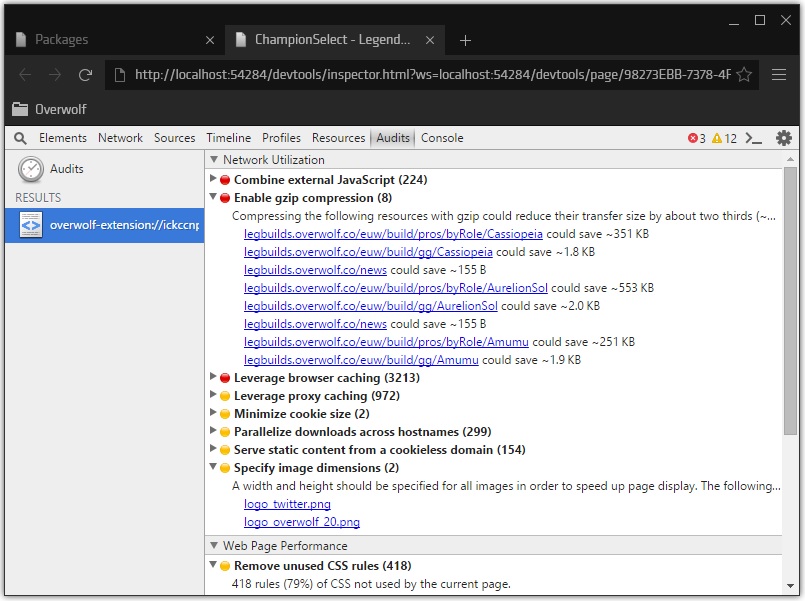
Audits
This tab analyzes your app and suggests ways for decreasing load times and increasing your app's responsiveness.
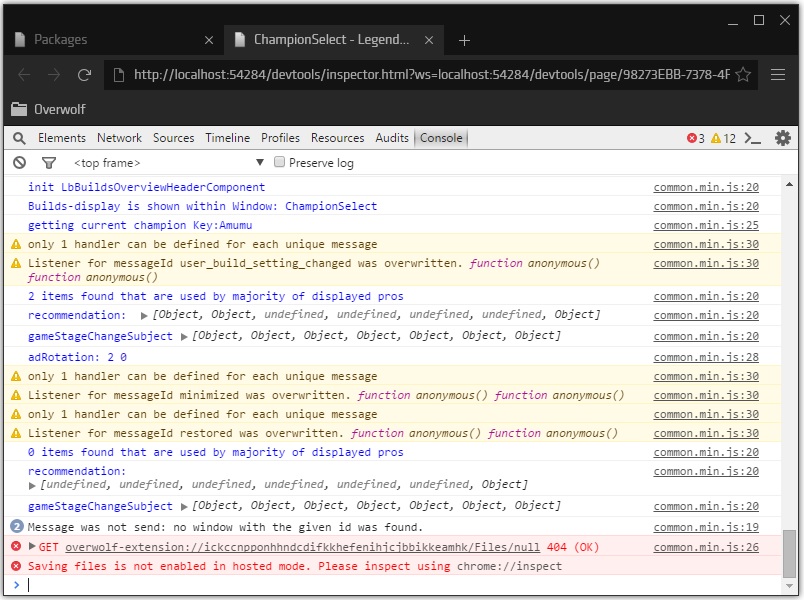
Console
This tab provides the ability to interact with your code, as well as logging capabilities to help you as you develop your application.
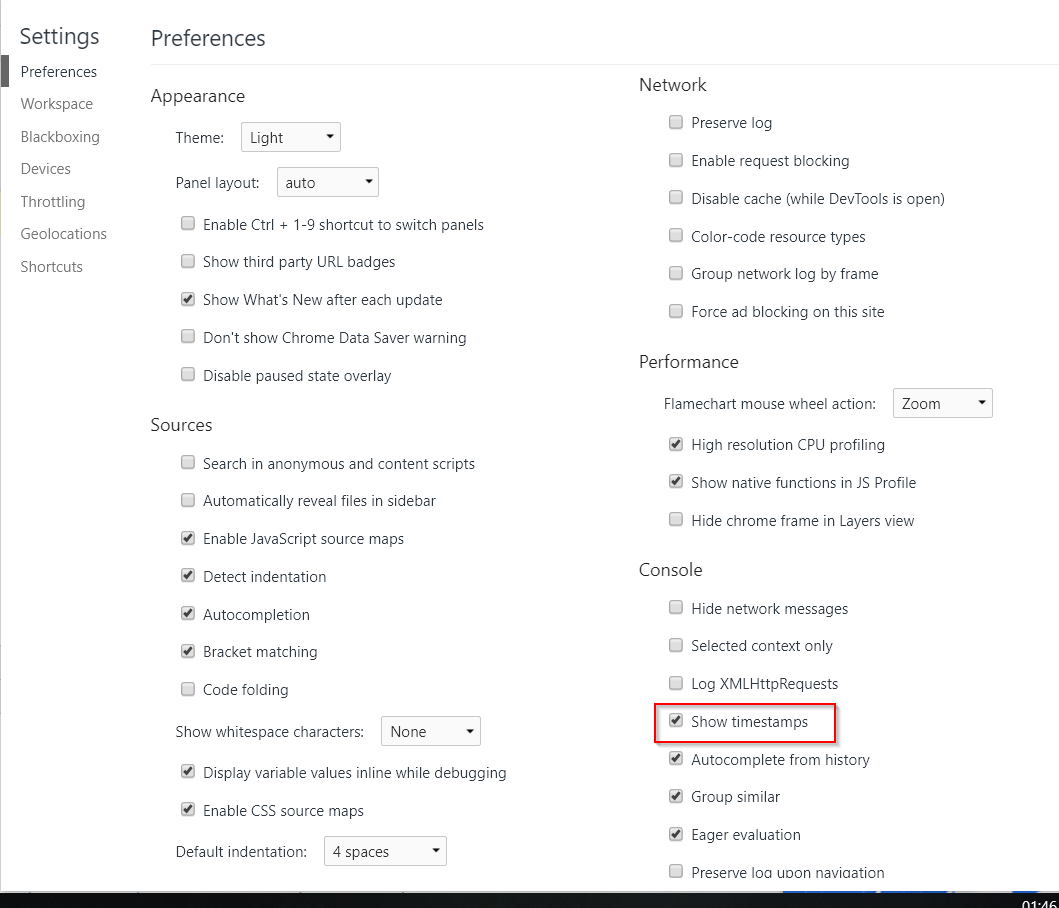
Enabling Time Stamps in Console
It is beneficial to see timestamps in your console when you are debugging. To enable this behavior, go to the console settings, and select your preferred timestamps preferences:
Using the remote debugger
In addition to the developer tools debugger, you can use the regular Chrome debugger.
The remote debugger has two advantages:
- Its easier to use in a secondary monitor. For some cases (for example, when debugging in-game windows), it's more convenient to open the debugger on a different screen and not as an in-game Overlay that can hide the UI.
- It may eliminate overwolf debugger related issues. In certain circumstances, it be advantageous to open another debugger window to display the data differently.
To use the remote debugger:
- Make sure your Overwolf app is running.
- Open a new chrome browser tab.
- Open http://localhost:54284.
You can see the list of all open Overwolf apps and windows. Press a link to open the remote developer tools for that window.
Use local debugger with debug_url flag
For local-server debugging (e.g, with React apps) you can use the debug_url flag in the manifest.json file.
Enabling automation testing with automation flag
It is possible to use a testing framework (e.g. Selenium) with your application. For more information, see Automated app testing.
Run your React app locally
Runs on a node.js server.
- Download a react project (E.g. This one).
- Extract it into a folder and open it in VS Code.
- Run the project using npm -i inside VS Code.
For this example, we assume that your react app is running on localhost:3000.
Debug your Overwolf app window locally
The following example app has two windows, a background controller called main and an app window called popup.
- In the app's manifest, add the debug_url flag on the same port as your React app (3000):
"popup": { "file": "popup.html","debug_url": "http://localhost:3000" }
- Load the app as an Unpacked extension.
- Open the CEF remote debugging URL in chrome (http://localhost:54284).
- Find the
mainapp window on the list, and open it. The dev console will open for this window. - Open the
popupwindow by typing into the console:The popup window will open, and your react app will load up inside of it.overwolf.windows.obtainDeclaredWindow('popup', console.log)overwolf.windows.restore('popup', console.log)
Now every change made in the react code is seen in the Overwolf window.
Notes
- You must have a local web server installed on your machine.
- This only works when loading unpacked extensions.
- This only works when connecting directly to "localhost" / "127.0.0.1".
- When using
debug_url, callingoverwolf.windows.getMainWindow()produces a known issue, and it will not work as expected. The API returns a reference to the current window instead of the main window.