Performance statistics
The Performance statistics dashboard is designed to give you a detailed analysis of the performance of your app. The dashboard contains the following panes:
Active users widgets
- Daily Active Users (DAU)—measures the number of unique users who interact your app in a single 24-hour period.
- Monthly Active Users (MAU)—the amount of unique users who have had an app window open at least once in a specific month.
- DAU per Country—the total number of daily active users per country, per day.
These widgets are typically used to measure:
- User Engagement—a high DAU indicates that users find value in your app and are using it regularly.
- Growth Tracking—can help you monitor user growth trends over time.
- Churn Detection—a drop in DAU can be an early signal of user dissatisfaction or technical issues.
App specific widgets
- App Installs (total vs unique)—the total amount of app installations per day. Typically used to measure:
- User acquisition effectiveness—how well marketing campaigns or the app store are driving new users.
- Market demand—high daily install counts can suggest and increase in popularity.
- Trend analysis—monitoring installs over time can help spot seasonality, campaign effectiveness, or app performance.
- App Uninstalls (total vs unique)—the total amount of times the app was uninstalled per day. Typically used to measure:
- User retention and satisfaction—a spike in uninstalls may indicate bugs, poor user experience (UX), or unmet expectations.
- App quality and performance—can signal crashes, slow performance, or other issues.
- Feature Impact Analysis—non-working or missing features may lead to uninstalls.
- App Version by DAU—the app version distribution among Daily Active Users.
- Partner Report (App Game DAU)—highlights which games were open while the app was live. This metric indicates how many unique users in a day interacted with a specific game while using the app.
note
- Reports all open games even if the game is not supported by the app.
- Last open game is reported.
- Window Open Count Per Day—the amount of times an average user closes a given app's window per day. This chart can be filtered based on the id of the window in the
manifest.jsonfile. Typically used to measure:- Engagement patterns—opening/closing the app, and length of focus on the app.
- UI/UX concerns—could indicate high crash rates, poor UI/UX, or unclear value proposition.
- Median Window Open Duration Per Day—the total duration (in seconds) an average user spends in an app window per day. Typically used to measure:
- Engagement depth—how much time users spend in the app per day.
- Value proposition—the longer users stay in the app, the more useful they think it is.
- App Window Open Duration Distribution—ow long the app window remains open before being closed or backgrounded. Typically used to measure:
- Behavioral insights—length of session can help understand app behavior (e.g., shorter sessions for app crashes, poor UI/UX, etc. and longer sessions deeper engagement and higher value to the user).
- App optimizations—fine tune the app's content by understanding how long users spend in the app.
User retention widgets
User retention widgets are used to indicate the percentage of users who continue to use the app after their first interaction, measured in age (e.g., days weeks, months). The following widgets are available:
- User Retention (Daily)—the percentage of users that installed the app on a specific date and were counted as active a number of days later.
- User Retention (Weekly)—the percentage of users that installed the app in a specific week and were counted as active a number of weeks later.
- User Retention (Monthly)—the percentage of users that installed the app in a specific month and were counted as active a number of months later.
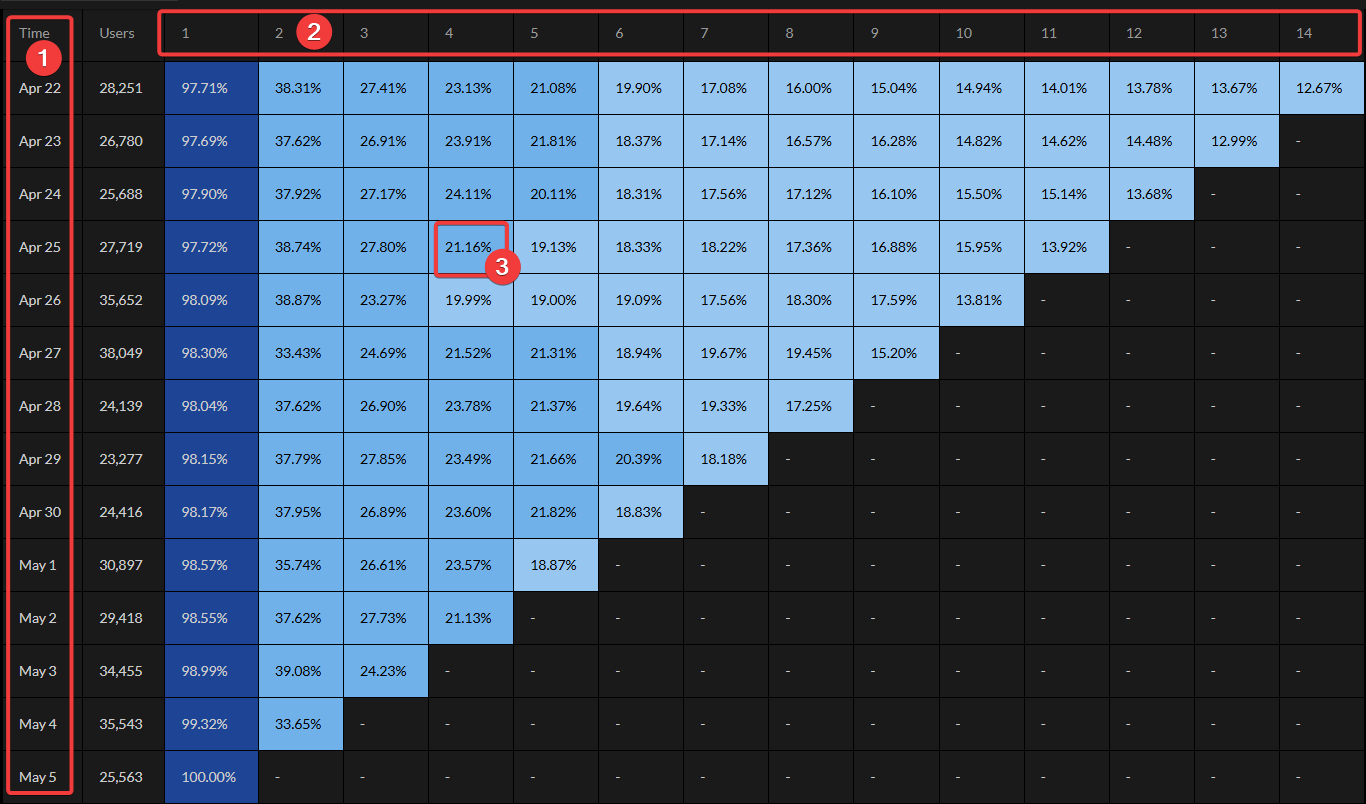
Understanding the user retention matrix
The following section will explain how to read the user retention matrix. In the User retention (Daily) matrix example below, the rows marked Time (#1 in the example) are specific dates and the columns are Days (#2 in the example) from the late listed. The number in the cell (26.1% #3 in the example) is the percentage of users who still have the app installed. The darker shades in the cells represent higher retention rates, making it easier to identify trends visually.